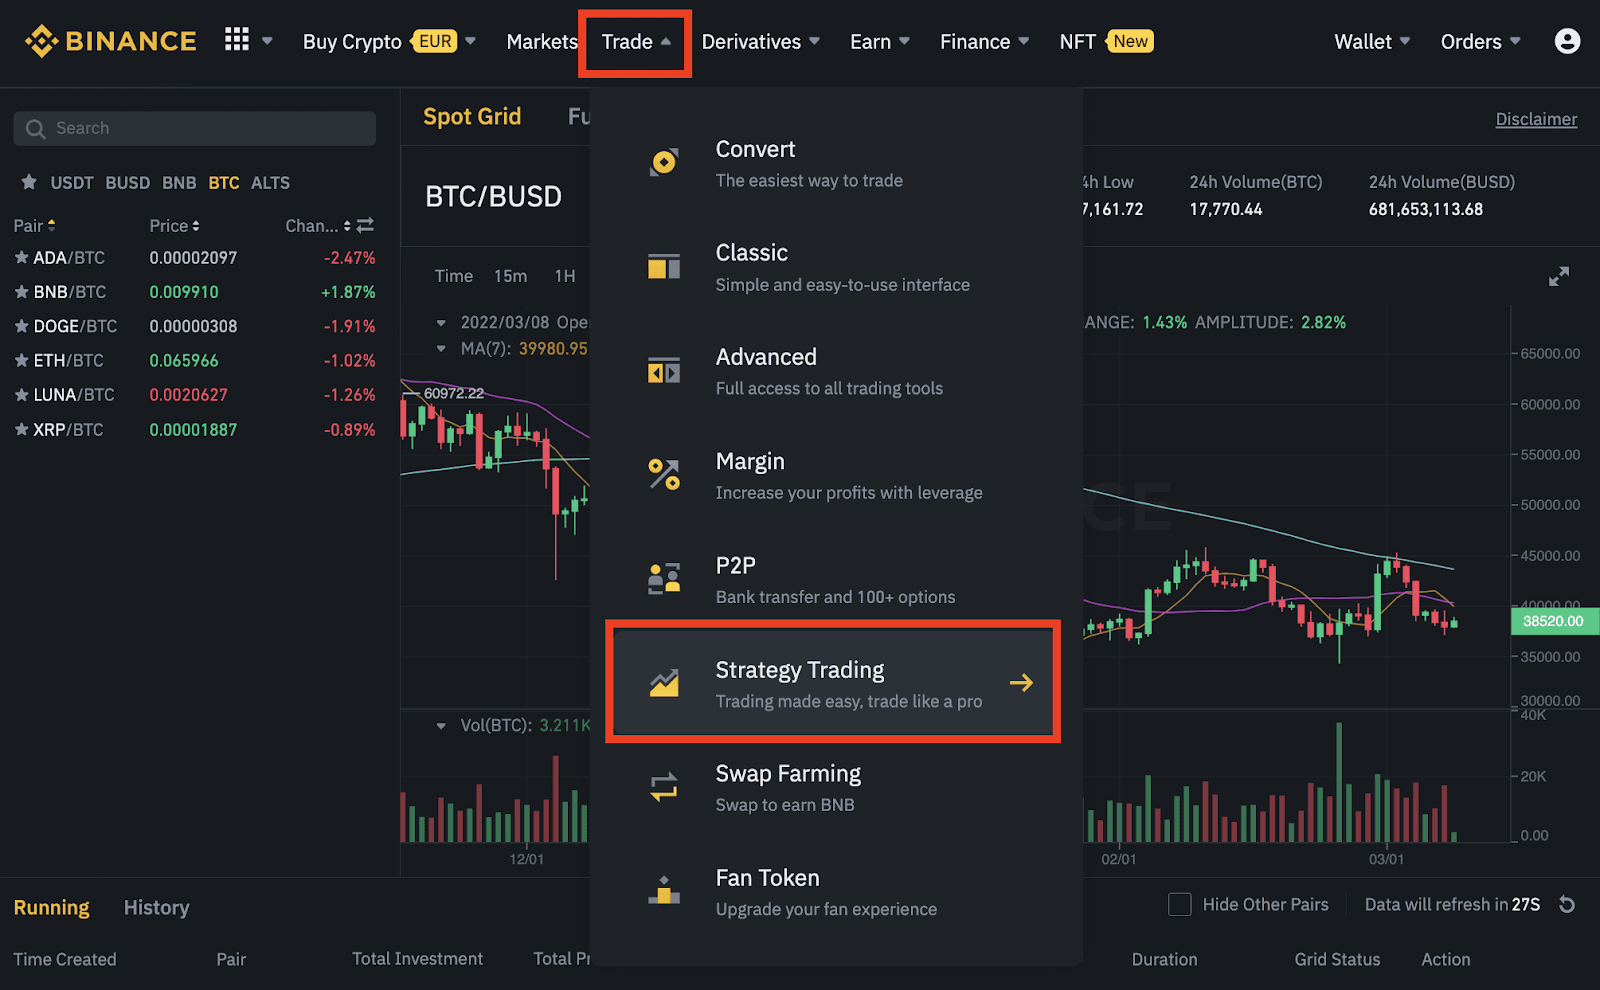
The hammer candlestick is one of the most popular pattern in technical analysis. It makes it possible for investors to judge the potential reversal of the market and assess the probability of the outcome when viewing price movements. Combined with trading strategy and other market analysis techniques, hammer candlestick pattern can give investors potential trading opportunities and good entry points for long and short positions.
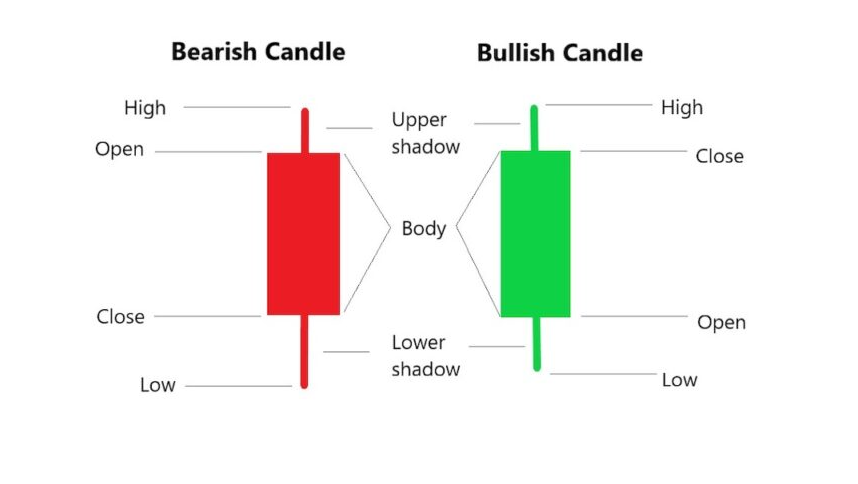
In candlestick charts, each candle involves a certain period of time, it depends on the time frame the investor chooses to observe. If you look at the daily chart, each candle shows trading activity in a day. If you look at the chart every 4 hours, each candle shows trading activity for 4 hours. Each candlestick has an opening price and a closing price (forming the body); the highest and lowest prices during that period (forming the wick or shadow).
What is the hammer candlestick pattern?
Hammer candlestick patterns are formed when a candle has a small body and long wick (shadows) below. The size of the wick should be at least twice the size of the body. The long wick below shows that the seller has pushed the price down before the buyer pushes the price above the opening price.
>>> Related: Guide to sign up for Binance account update 2022
Common hammer candlestick patterns
Bullish hammers
-
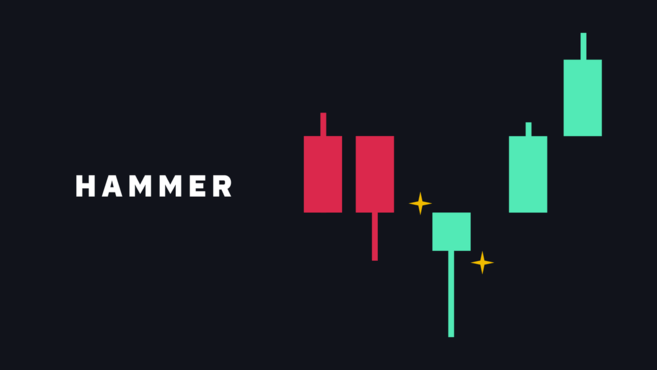
Hammer candlestick pattern
This pattern is formed when the closing price is higher than the opening price. That means the buyer already has control of the market before the end of that transaction.
-
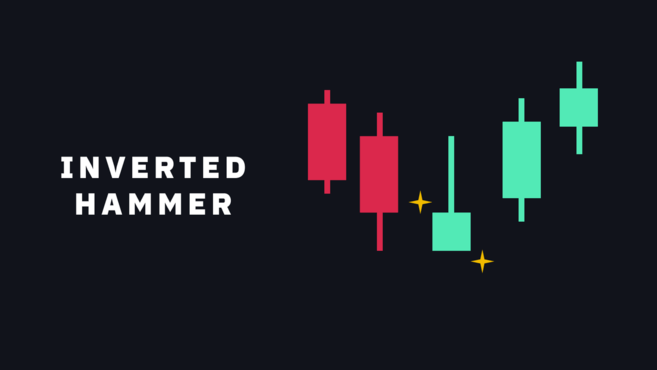
Inverted hammer candlestick pattern
The opening price lower than the closing price results in the formation of the inverted hammer candlestick pattern. The long wicket shows great buying pressure and it is working hard to push up prices. However, the price was pulled down before the candle closed. Although not as bullish as the model above, this is a bullish reversal pattern that appears after a downtrend.
Bearish hammers
-
Hanging man candlestick
This pattern is formed when the opening price is higher than the closing price which gives the appearance of a red candle. The bearish wicket indicates that the market has just experienced selling pressure. This indicates the possibility of reversing the price decline.

-
Shooting star candlestick
This is the pattern that illustrates the downward reversal hammer. It is formed when the opening price is higher than the closing price. The shooting star candlestick pattern suggests the upcoming market up to end.

Characteristics of hammer candlestick pattern
Pros
- The hammer candlestick pattern can detect a trend reversal in cryptocurrency market as well as other financial markets.
- The hammer candlestick pattern can be applied in many time frames. It is especially useful in both swing trading and day trading.
Cons
Whether the market reverses or not depends on many factors while hammer candlestick patterns can be created by another factor.
Therefore, it is impossible to make sure that appearing hammer candlestick pattern make the market definitely reverse. Investors often combine this model with other strategy or tools to increase the likelihood of accuracy and chances of success.
How to trade with hammer candlestick pattern
Entry points, take profit and stop loss
In order to trade with the hammer candlestick pattern in the most profitable and risk-minimizing way, investors must keep in mind that the ideal trading time frame for this model is the D1 (1 day) and H4 (4 hours) framework to determine the appropriate entry point.
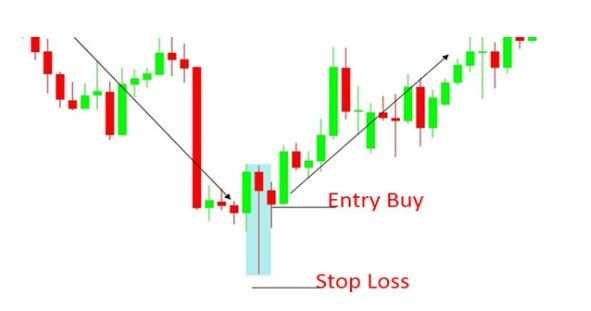
The way to determine the entry point with the hammer candlestick pattern is to enter the BUY order at some point to get a high profit:
- Method 1: At a price equal to 50% of the length of the entire hammer candle. This is considered as the standard entry point so that the investor can get the highest return when the pattern occurs correctly.
- Method 2: At the opening price of the candle immediately after the hammer candle (confirmation candle). This is a way to open a less profitable order but is safer and less risky in case the price does not meet expectations. This method is very suitable for new investors who have small capital and experience.
- Method 3: Immediately after the end of the trading session form hammer candlesticks. This is considered the safest and surest way. At this time, the buying force is already extremely strong and the uptrend will go up even higher.
Stop loss point: Cut loss just below the wick of the hammer candle 2-3 pips.
Take-profit point: Take profit above the highest price of the hammer candlestick when the R:R ratio reaches 1:2.
Combined with technical indicators
In fact, the hammer candlestick pattern is also influenced by many external factors. So, trading with the hammer candlestick model that investors do not combine using more technical indicator tools is a risky move, the profit will not be high and not long-lasting.
Combined with support levels
Usually, the probability of the price reversing upwards is very high when the hammer candlestick pattern appears in the support area. Therefore, the support level can be a tool to signal the price reversal that investors can trust.
After determining the trend of the falling general market and the appearance of the hammer candlestick pattern in the supporting price zones, the investor can open the BUY order as soon as the hammer candlestick ends and place the cut-loss order below the tail of the candle a few pips. Besides, to be sure the price will go as planned, investors can also place BUY orders when the confirmation candle has formed. At this time, the combination with the support area, the trading signal will become very reliable.
Combined with the RSI indicator line
This is a very reputable reversal signal technical analysis tool and is favored by many experienced investors. They often use the 20-80 line when determining overbought, oversold with RSI.
The RSI enters the oversold zone cutting the threshold of 20 or less and the completed hammer candlestick pattern is a great time for investors to enter the BUY order (at the closing price of the hammer candlestick). After that, the investor will make a loss cut just below the tail of this model.
Note when using a hammer candlestick pattern
To use the model effectively in trading, investors need to consider their position relative to the front and back candlesticks.
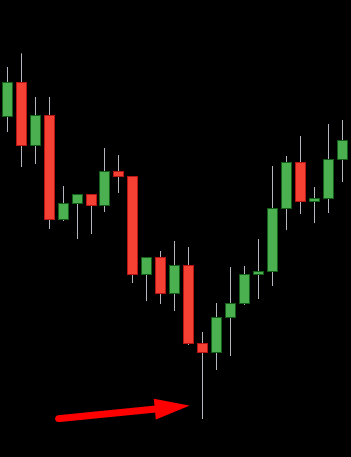
Bullish hammer candlesticks appear in bearish trends and indicate that the price is likely to reverse, marking the bottom of the downtrend.
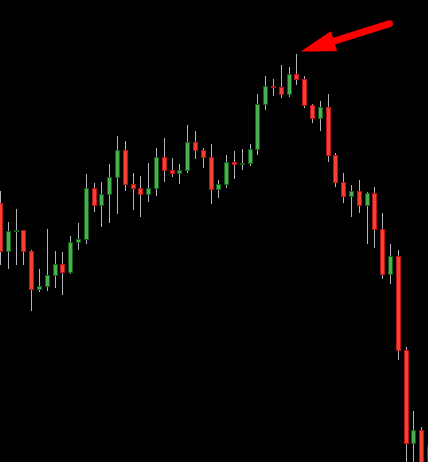
The bearish hammer candlestick appears after bullish trends and indicates the possibility of a downward reversal.
Conclusion
The hammer candlestick pattern is a simple and relatively effective tool that helps investors predict market trends and potential reversals. However, this pattern accurately forecasts 100% of the buy or sell signal. Therefore, investors need to combine this model with other tools to have a more solid prediction. In the context of a volatile market, investors also need to carefully consider the reward ratio of trades, using flexible stop-loss orders to avoid large losses.
Related: How to register and verify Binance account udate 2022


