From traditional portfolios to cryptocurrencies like Bitcoin or Ethereum, technical analysis (TA) is an important step to make accurate trading decisions that lead to the desired outcomes. After decades of development, hundreds of technical analysis indicators were created, but the moving average (MA) is a popular analytical indicator, used by a large number of investors.
Currently, there are many dynamic moving average variations developed that aim to make the trading chart clear and create a trend index that can be easily comprehended. The moving average is based on past data, so it is considered as the following indicators. In other words, the moving average only shows the changes that have occurred but still has a significant impact on market trends.
What is the moving average?
In short, the moving average (MA) is a technical analysis tool to smooth the price data on the line graph over time, helping to express market trends more clearly.

Classification of moving average
As mentioned above, there are many different types of moving averages with different characteristics and different uses (in day trading, swing trading, and also in long-term settings). However, the moving averages are divided into only two main categories: the simple moving average (SMA) and the exponential moving average (EMA). The investor can select one of these indicators depending on the market, the desired outcome, investment strategy and risk appetite.
-
Simple Moving Average (SMA)
SMA takes data from a period of time and calculates the average price of the asset for the data set taken. As soon as you enter a new data set, the oldest dataset will be ignored.This is the biggest difference between the SMA and the basic plus average number of past prices. That is, if the SMA calculates the average values based on 10-day data, the entire dataset will be constantly updated but only includes the last 10 days.
All data in an SMA line is assigned equal weights that have no regard to how long they were entered. For investors who believe that the latest data will reflect the most accurate relevant information, the equal weighting of SMA is a major disadvantage for technical analysis. And this is the reason that the exponential moving average is created.
-
Exponential Moving Average (EMA)
Similar to the simple moving average, the exponential moving average also offers technical analysis based on past market price movements.
However, EMA has a much more complex equation because it attaches more weight and value to the latest price inputs. Therefore, EMA reacts more quickly to price fluctuations and market reversals. Obviously, EMA has the ability to forecast price reversals faster than SMA, so investors often use this line graph in short-term trading.
Although both moving averages are widely used due to their high value in technical analysis, each investors should also choose the type of line according to their investment strategy and goals to make the most appropriate setting adjustments.
>>> Related: Step-by-step guide to sign up for Binance account update 2022
How to calculate the moving average
To calculate the SMA, investors can average the closing price of trading sessions according to the following formula: A1, A2, An is the closing price of trading sessions n is the total number of trading sessions However, this calculation has mostly been performed by charting or TradingView software, including exponential moving averages (EMA).

- A1, A2,… An is the closing price of trading sessions
- n is the total number of trading sessions
However, this calculation has mostly been performed by TradingView or charting software, including exponential moving averages (EMA).
How to use the moving average line
As mentioned above, the moving average utilizes previous price data instead of the current price so it has a certain period of lag depending on dataset. The more expansive the dataset, the greater the latency time. For instance, a moving average analyzed 100 days ago would have reacted more slowly to new fluctuations than the 10-day analysis moving average . A new data is entered a much larger dataset than it will result in less drastic changes in total.
Moving averages are based on datasets that benefit long-term investors because they are less likely to be changed much due to one or two fluctuations. On the contrary, short-term investors often prefer to use MA based on small datasets to determine the smallest fluctuations of the market.
In traditional financial markets, moving averages with 50, 100, or 200-day datasets are the most popular. In the cryptocurrency market, any break on these lines, especially followed by crossover is considered an important trading signal. Since the market fluctuates 24/7, moving averages settings can vary depending on each investor’s strategy.
Although it most fundamentally reflects the market’s up-and-down trend, the MA is not yet a reliable strong indicator. Therefore, it is used in combination with intersecting signals. This signal appears when two different MAs crosses above other on the chart. The crossover in an uptrend (a golden cross) is when the short-term moving average crosses above the long-term line, which is the starting point of an uptrend.
On the contrary, the crossover in the downtrend (death cross) occurs when the short-term moving average crosses below the long-term, which is the signal of the downtrend.
The data by day is not a necessary requirement when analyzing the moving average. Each investor may be interested in the volatility that takes place over a certain period of time, as long as it is consistent with the trading strategy.
Common moving averages
- Short-term MA: MA10, MA20
- Medium-term MA: MA50
- Long-term MA: MA100, MA200, MA730
How to add a moving average on TradingView
- Step 1: Go to TradingView homepage, click on [Symbol Search] to look for cryptocurrency.
![Go to TradingView homepage, click on [Symbol Search] to look for cryptocurrency](https://wikibinance.com/wp-content/uploads/2022/05/MA-1.png)
- Step 2: Click [Indicators] to search for the keyword “Moving Average” or MA and select the type of moving average required
![Click [Indicators] to search for the keyword "Moving Average" or MA](https://wikibinance.com/wp-content/uploads/2022/05/MA-3.png)
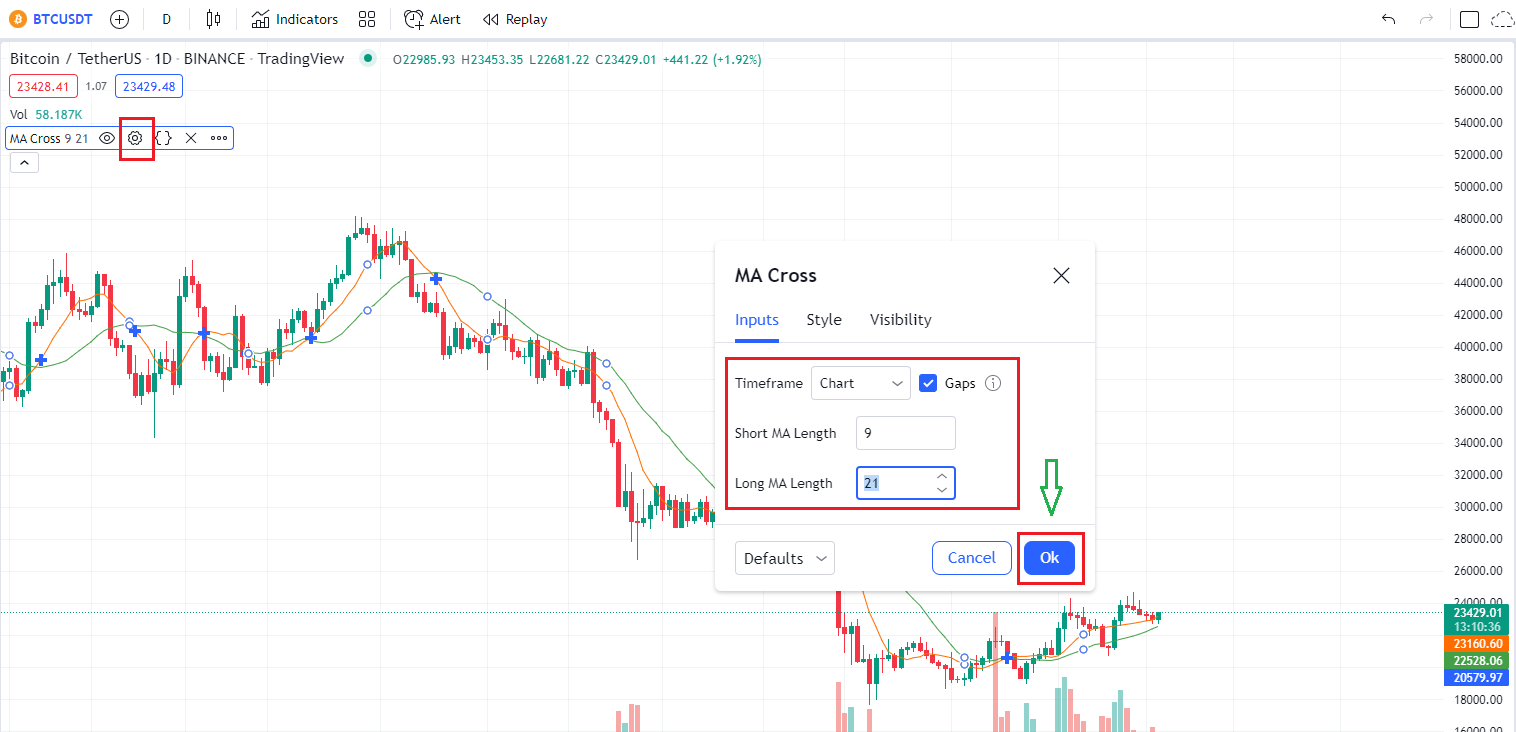
- Step 3: After the moving averages appear on the chart, the system will default EMA9 and MA9. Click on Settings icon to change the above metrics if needed. Enter the desired long and short length, and then press [OK].

Click on settings icon to change the above metrics
Reasons to choose the EMA instead of the SMA
EMA follows market movements, easily detects abnormal signals, and forecasts reversals faster than SMA. The simple moving average is suitable for short-term transaction in a short time frame, so investors use it to conduct scalping transactions with large leverage.
However, being too sensitive to the market can be the downside of EMA, as it causes interference signals. Therefore, investors should build investment discipline by placing stop-loss and take-profit orders.
>> Related: How to place stop-loss and take-profit orders
To optimize trading with EMA, investors need to develop the following strategies:
Trade on trend through the following cases:
- The price line above the EMA in each time frame indicates the uptrend for that EMA in that time frame → Should only buy, not sell.
- The price line below the EMA in each time frame confirms the downtrend for that EMA in that time frame → should only sell, not buy.
- The EMA line that crosses the price line confirms the sideway price line, there is no clear trend for in that time frame → waiting for a clear confirmation signal before trading.
Therefore, using small EMA to identify the general trend is inaccurate. To determine the long-term trend of the market, investors should use EMA200 on the D1 time frame
EMA plays the role of Resistance – dynamic support
The price tends to go back to testing the EMA lines, and at that price there is a certain reaction. Therefore, investors can apply the following 2 ways to conduct trading:
- Wait for the price to return to the EMA and proceed to the trend order
- If the price confirms the trend reversal and breaks the EMA then it is advisable to wait for the backtest and then place the trend order.
Combined with other indicators
The moving average need to be combined with other technical analysis tools to confirm the signal multiple times and avoid interference.
The basic analysis lines that investors can refer to to strengthen their trading decisions are: Trendline, Volume, RSI …
Conclusion
The moving average is one of the most powerful and most commonly used technical analysis indicators. Although moving average has lag time, it can give insight into how the market works based on real data. However, predicting prices in financial markets is still not a simple task, it requires the experience and acumen of investors.
Investors should combine moving average with other indicatiors to create a solid trading system on their own and make an informed decision.


